Nuclear Energy: Fact Check
March 2011 | Research & Analysis
How Much Does the United States Use?
With the nuclear reactor crisis in Japan continuing to unfold, an important discussion has been taking place in the U.S. about the current and future role of nuclear energy and our aging nuclear reactors. We have noticed that in the media, there is sometimes a gap between what is being stated as fact, and what is actually fact. For example, prominent U.S. officials have stated recently, “We get 20 percent of our energy right now in the United States from nuclear power.”
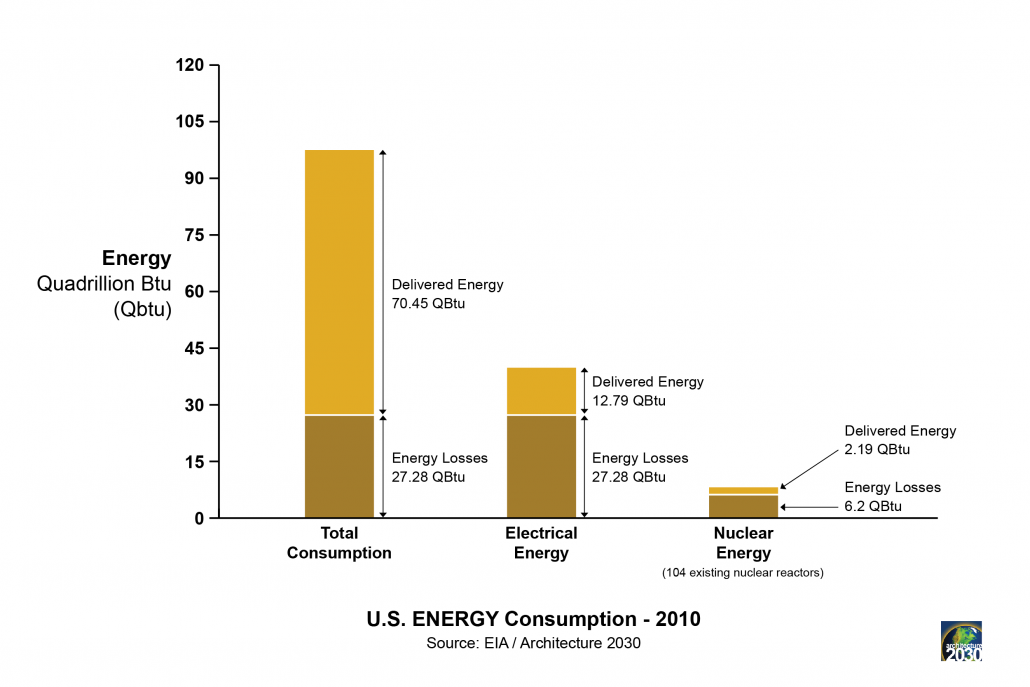
In fact, nuclear power is responsible for 8.6% of total U.S. energy consumption.
Twenty point seven percent of total U.S. electricity consumption, including electrical energy generation and transmission losses, is attributed to nuclear power. The 20.7%, or 8.39 QBtu, is made up of 2.19 QBtu of electricity delivered to the place of use, and 6.2 QBtu of energy losses from generation (waste heat) and transmission.
The following graph illustrates total U.S. energy consumption (delivered energy and electrical energy losses from generation and transmission), total U.S. electricity consumption, and the total U.S. energy consumption attributed to nuclear power:

Assumptions: Average U.S. nuclear plant efficiency is calculated at 32.6% (Source: EIA [3][4]), and transmission losses at 6.5% (Source:EIA [5]).
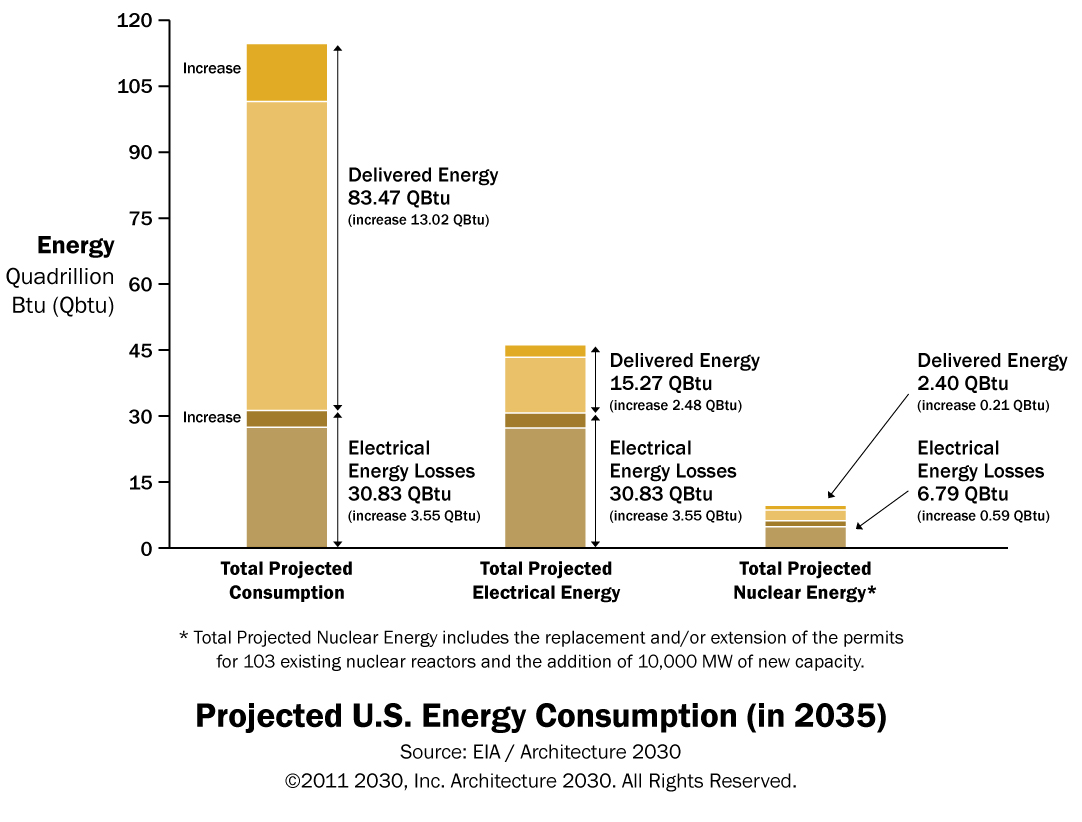
The following graph illustrates U.S. Energy Consumption in 2035, as projected by the U.S. Energy Information Administration (EIA).

Notes: In 2035, nuclear energy is projected to provide 2.9% of total U.S. delivered energy; 8.0% of total projected U.S. energy consumption is attributed to nuclear energy. (Source: Architecture 2030 & EIA)
In 2035, nuclear energy is projected to provide 15.7% of total U.S. delivered electricity; 19.9% of total U.S. electricity consumption is attributed to nuclear energy (Source: Architecture 2030 & EIA)
More to Know About U.S. Nuclear Energy:
- There are 104 nuclear reactors currently operating in the U.S. (Source: NEI) [1]
- The 104 reactors have a net summer capacity of 100,755 MW. (Source: Architecture 2030 & NEI) [2]
- Nuclear energy provides 3.1% of total U.S. delivered energy; 8.6% of total U.S. energy consumption is attributed to nuclear energy. (Source: Architecture 2030 & EIA) [3][4][5]
- Nuclear energy provides 17.1% of total U.S. delivered electricity; 20.7% of total U.S. electricity consumption is attributed to nuclear energy (Source: Architecture 2030 & EIA) [3][4][5]
- It takes approximately thirty-seven 1000MW nuclear reactors to produce one Quad (quadrillion Btu) of delivered energy. (Source: EIA, Table 6.1.2) [6]
- The last nuclear reactor to be built in the U.S. was Watts Bar 1 in Tennessee in June 1996 (1,123 MW). (Source: NEI) [1]
- Of the 104 nuclear reactors in the U.S., 4.8% are older than 40 years, 38.5% are older than 35 years, and over half are older than 30 years. (Source: Architecture 2030 & EIA, Table 3) [7]
- Nuclear reactors in the U.S. are licensed to operate for 40 years. Owners can file with the Nuclear Regulatory Commission (NRC) for operating extensions. (Source EIA) [8]
- It costs approximately $300-500 million to decommission a nuclear plant. (Source: NEI) [9]
- There are 13 potential reactors that are currently under review for a new commercial license. (Source: EIA) [10]
- The EIA estimates that the initial capital cost (overnight cost) of a new reactor is $5,339 per kW, or $5.3 billion for a 1000 MW reactor. Financing cost, long construction periods, and escalating costs can push the total cost well above the overnight cost. (Source: EIA, Table 2) [11]
- Subsidies for ongoing nuclear reactors range from 0.74 – 4.16 c/kWh for investor owned utilities (IOUs) and 1.53 – 5.77 c/kWh for publicly owned utilities (POUs). Subsidies for new reactors range from 5.01 – 11.42 c/kWh for IOUs and 4.20 – 8.68 c/kWh for POUs. At the higher end of these ranges, the subsidies exceed the value of the energy produced. The subsidies come from a wide range of sources: federal loan guarantees (Title 17 of the Energy Policy Act, EPACT, 2005), accelerated depreciation, subsidized borrowing costs, property tax abatements, depletion allowances for uranium mining, under-priced water for cooling, and production tax credits. In addition, the federal government helps significantly with security, risk, waste, and decommissioning management. (Source: UCS) [12]
- The IAEA estimates that approximately 20 percent of nuclear reactors around the world are currently operating in areas of significant seismic activity. (Source: IAEA) [13]
- The mean construction time (construction start date to first date of commercial operation) for the 104 nuclear reactors is 9.3 years. Over forty percent of the reactors (41.35%) had construction periods greater than 10 years, and 7.69% had construction periods over 15 years. The last nuclear reactor to come online (Watts Bar 1 in Tennessee) actually had a construction period of 23 years and almost 7 months. (Source: Architecture 2030 and EIA)
- The latest application for a new nuclear reactor (June 2009: Turkey Point Units 6 and 7, Homestead, FL) estimates the total project cost between $12.8 billion to $18.7 billion for the two reactors (combined capacity of 2,234 MW). (Source: NRC and EIA)
- In 2009, nuclear fuel cost 0.57 c/kWh. A nuclear reactor is refueled every 18-24 months (replacing a third of its core) at a cost of $40 million. (Source: NEI)
- A typical nuclear power plant generates 20 metric tons of used nuclear fuel annually. The U.S. nuclear industry generates a total of 2,300 metric tons of used fuel per year. (Source: NEI)
- The U.S. currently holds 62,490 metric tons of used nuclear fuel (uranium). Illinois, Pennsylvania, and South Carolina are the states that hold the largest amounts at 7,670, 5,650, and 3,780 metric tons, respectively. (Source: NEI)
- On March 3, 2010, the U.S. Department of Energy requested to withdraw the license for Yucca Mountain, ending the only U.S. program for a high-level nuclear waste repository. A Blue Ribbon Commission has been established to study alternative options for long-term storage of high-level nuclear waste. (Source: DOE)
- The capacity factor of nuclear plants in 2009 was 90.5%. (Source: NEI)
Reported by Architecture 2030 Researchers:
 |
Vincent Martinez Director of Research |
 |
Francesca Desmarais Principal Researcher |
ABOUT US
Architecture 2030’s mission is to rapidly transform the built environment from the major contributor of greenhouse gas emissions to a central solution to the climate crisis.


