Architecture 2030
  • Thought Leadership
    • Latest Thought Leadership
    • Why The Built Environment?
    • The 2030 Challenges
    • News and Developments
    • Subscribe to our E-News
  • Actions
    • Existing Buildings
    • New Buildings
    • Embodied Carbon
  • Empowering the Building Sector
    • Design & Planning
      • CARE Tool
      • AIA+2030 Online Series
      • 2030 Palette
      • Carbon Smart Materials Palette
      • Zero Code
      • Zero Tool
    • Education
      • 2030 Palette
      • CarbonPositive
      • Carbon Smart Materials Palette
      • AIA+2030 Online Series
    • Policy
      • CARE Tool
      • Achieving Zero
      • Zero Code
      • Embodied Carbon Policy Framework
      • Zero Tool
    • Collaborations
      • 2030 Commitment
      • China Accord
      • Advancing Net Zero
      • Carbon Leadership Network
      • 2030 Districts Network
  • About
    • Our Mission
    • Leadership
    • FAQs
    • Equity Statement
  • Search
  • Menu
  • Linkedin
  • Twitter
  • Mail

Sullivan’s Island, SC

June 23, 2010/0 Comments/in Nation Under Siege, South Carolina /by arch2030

Sullivan’s Island, SC


1.25 meter rise


1.75 meter rise

1.25-1.75 meter sea level rise; Population: 1,897
Data Source: NOAA CSC LIDAR
Maps are based on LIDAR data, USGS 10m NED.
Maps are illustrative; areas in blue depict various potential inundation scenarios.
Map accuracy is dependent on the accuracy of the geospatial data.
Mt. Pleasant, SC Back to Nation Under Siege Corpus Christi, TX

https://architecture2030.org/wp-content/uploads/2018/09/HiRes_SullivansIsland_SC_1.75M-01.png 490 910 arch2030 https://architecture2030.org/wp-content/uploads/2014/10/cropped-lowreslogoRGB-300x300.jpg 
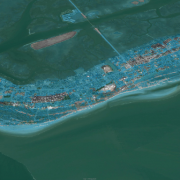
arch20302010-06-23 14:11:282018-09-21 19:44:04Sullivan's Island, SC

Mt. Pleasant, SC

June 23, 2010/0 Comments/in Nation Under Siege, South Carolina /by arch2030

Mt. Pleasant, SC


1.75 meter rise


3 meter rise

1.75-3 meter sea level rise; Population: 57,932
Data Source: NOAA CSC LIDAR
Maps are based on LIDAR data, USGS 10m NED.
Maps are illustrative; areas in blue depict various potential inundation scenarios.
Map accuracy is dependent on the accuracy of the geospatial data.
Morris Island, SC Back to Nation Under Siege Sullivan’s Island, SC

https://architecture2030.org/wp-content/uploads/2018/09/HiRes_Mt.Pleasant_SC_3.0M-01.png 490 910 arch2030 https://architecture2030.org/wp-content/uploads/2014/10/cropped-lowreslogoRGB-300x300.jpg 
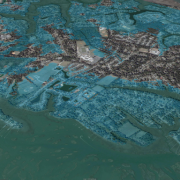
arch20302010-06-23 14:01:512018-09-21 17:57:34Mt. Pleasant, SC

Morris Island, SC

June 23, 2010/0 Comments/in Nation Under Siege, South Carolina /by arch2030

Morris Island, SC


1 meter rise


3 meter rise

1-3 meter sea level rise; Population: NA
Data Source: NOAA CSC LIDAR
Maps are based on LIDAR data, USGS 10m NED.
Maps are illustrative; areas in blue depict various potential inundation scenarios.
Map accuracy is dependent on the accuracy of the geospatial data.
James Island, SC Back to Nation Under Siege Mt. Pleasant, SC
https://architecture2030.org/wp-content/uploads/2018/09/HiRes_MorrisIsland_SC_3.0M-01.png 490 910 arch2030 https://architecture2030.org/wp-content/uploads/2014/10/cropped-lowreslogoRGB-300x300.jpg arch20302010-06-23 13:44:162018-09-21 17:53:41Morris Island, SC

James Island, SC

June 23, 2010/0 Comments/in Nation Under Siege, South Carolina /by arch2030

James Island, SC


2 meter rise


2.5 meter rise

2-2.5 meter sea level rise; Population: 33,871
Data Source: NOAA CSC LIDAR
Maps are based on LIDAR data, USGS 10m NED.
Maps are illustrative; areas in blue depict various potential inundation scenarios.
Map accuracy is dependent on the accuracy of the geospatial data.
Folly Beach, SC Back to Nation Under Siege Morris Island, SC

https://architecture2030.org/wp-content/uploads/2018/09/HiRes_JamesIsland_SC_2.5M-01.png 490 910 arch2030 https://architecture2030.org/wp-content/uploads/2014/10/cropped-lowreslogoRGB-300x300.jpg arch20302010-06-23 13:10:202018-09-21 17:48:05James Island, SC

Folly Beach, SC

June 23, 2010/0 Comments/in Nation Under Siege, South Carolina /by arch2030

Folly Beach, SC


1.5 meter rise

1.5 meter sea level rise; Population: 2,263
Data Source: NOAA CSC LIDAR
Maps are based on LIDAR data, USGS 10m NED.
Maps are illustrative; areas in blue depict various potential inundation scenarios.
Map accuracy is dependent on the accuracy of the geospatial data.
Charleston, SC Back to Nation Under Siege James Island, SC
https://architecture2030.org/wp-content/uploads/2018/09/HiRes_FollyBeach_SC_1.5M-01.png 490 910 arch2030 https://architecture2030.org/wp-content/uploads/2014/10/cropped-lowreslogoRGB-300x300.jpg arch20302010-06-23 13:04:342018-09-21 17:44:10Folly Beach, SC

Charleston, SC

June 23, 2010/0 Comments/in Nation Under Siege, South Carolina /by arch2030

Charleston, SC


1 meter rise


2 meter rise

1-2 meter sea level rise; Population: 106,712
Data Source: NOAA CSC LIDAR
Maps are based on LIDAR data, USGS 10m NED.
Maps are illustrative; areas in blue depict various potential inundation scenarios.
Map accuracy is dependent on
the accuracy of the geospatial data.
Quonochontaug, RI Back to Nation Under Siege Folly Beach, SC
https://architecture2030.org/wp-content/uploads/2018/09/HiRes_Charleston_SC_2.0M-01.png 490 910 arch2030 https://architecture2030.org/wp-content/uploads/2014/10/cropped-lowreslogoRGB-300x300.jpg arch20302010-06-23 12:59:462018-09-21 17:36:09Charleston, SC

Search

Latest News

  • ANDREW WAUGH
  • RICK SCHWOLSKY
  • LISA RICHMOND
  • LEON (LIHONG) QIU

Sign up to receive our E-News!

* = required field

ABOUT US

Architecture 2030’s mission is to rapidly transform the built environment from the major contributor of greenhouse gas emissions to a central solution to the climate crisis.

Contact Us

Architecture 2030
607 Cerrillos Road
Santa Fe, NM 87505

info@architecture2030.org

505.988.5309
© Copyright - Architecture 2030 - powered by Enfold WordPress Theme
Scroll to top