https://www.architecture2030.org/wp-content/uploads/2018/09/HiRes_UnionCity_CA_1.75M-01.png
490
910
arch2030
https://www.architecture2030.org/wp-content/uploads/2014/10/cropped-lowreslogoRGB-300x300.jpg
arch20302010-06-10 11:36:392018-09-21 20:22:11Union City, CA
https://www.architecture2030.org/wp-content/uploads/2018/09/HiRes_SanRafael_CA_1.25M-01.png
490
910
arch2030
https://www.architecture2030.org/wp-content/uploads/2014/10/cropped-lowreslogoRGB-300x300.jpg
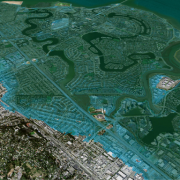
arch20302010-06-10 11:31:192018-09-21 20:19:44San Rafael, CA
https://www.architecture2030.org/wp-content/uploads/2018/09/HiRes_SanFrancisco_CA_2.25M-01.png
490
910
arch2030
https://www.architecture2030.org/wp-content/uploads/2014/10/cropped-lowreslogoRGB-300x300.jpg
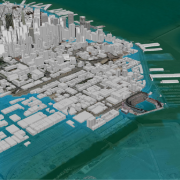
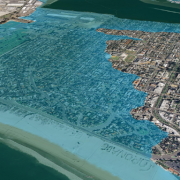
arch20302010-06-10 10:48:512018-09-21 20:17:26San Francisco, CA
https://www.architecture2030.org/wp-content/uploads/2018/09/HiRes_SanDiego_CA_5.0M-01.png
490
910
arch2030
https://www.architecture2030.org/wp-content/uploads/2014/10/cropped-lowreslogoRGB-300x300.jpg
arch20302010-06-10 10:40:252018-09-21 20:15:43San Diego, CA
https://www.architecture2030.org/wp-content/uploads/2018/09/HiRes_OaklandAirport_CA_1.25M-01.png
490
910
arch2030
https://www.architecture2030.org/wp-content/uploads/2014/10/cropped-lowreslogoRGB-300x300.jpg
arch20302010-06-09 17:00:302018-09-21 21:19:44Oakland Airport, CA
https://www.architecture2030.org/wp-content/uploads/2018/09/HiRes_NewportBeach_CA_1.75M-01.png
490
910
arch2030
https://www.architecture2030.org/wp-content/uploads/2014/10/cropped-lowreslogoRGB-300x300.jpg
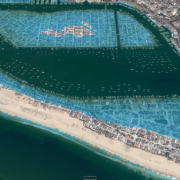
arch20302010-06-09 14:10:012018-09-20 21:58:13Newport Beach, CA
https://www.architecture2030.org/wp-content/uploads/2018/09/HiRes_MarinaDelRey_CA_5.0M-01.png
490
910
arch2030
https://www.architecture2030.org/wp-content/uploads/2014/10/cropped-lowreslogoRGB-300x300.jpg
arch20302010-06-09 14:09:442018-09-20 21:55:35Marina Del Rey / Santa Monica, CA
https://www.architecture2030.org/wp-content/uploads/2018/09/HiRes_FosterCity_CA_1.25M-01.png
490
910
arch2030
https://www.architecture2030.org/wp-content/uploads/2014/10/cropped-lowreslogoRGB-300x300.jpg
arch20302010-06-09 13:58:572018-09-20 21:32:42Foster City / San Mateo, CA
https://www.architecture2030.org/wp-content/uploads/2018/09/HiRes_Coronado_CA_5.0M-01.png
490
910
arch2030
https://www.architecture2030.org/wp-content/uploads/2014/10/cropped-lowreslogoRGB-300x300.jpg
arch20302010-06-09 13:58:502018-09-20 21:17:33Coronado, CA
https://www.architecture2030.org/wp-content/uploads/2018/09/HiRes_Alemeda_CA_5M-01.png
490
910
arch2030
https://www.architecture2030.org/wp-content/uploads/2014/10/cropped-lowreslogoRGB-300x300.jpg
arch20302010-06-08 16:23:122018-09-20 20:05:39Alameda, CA